
The art and science of forecasting with clinical informatics
The pharmaceutical industry continues to strive to improve the quality and efficiency of clinical trials but many challenges remain with these costly and complex operations. One key factor in effectively managing a study from the start requires a realistic estimate of timelines and selection of the most likely investigators and sites to accelerate patient enrollment.
Clinical informatics continues to play a larger role in guiding the overall process. Michelle Jones, Senior Director of Clinical Development Services Clinical Informatics at Covance and Emily Ricketts, Executive Director, Investigator and Health System Relationships, recently discussed how new informatics capabilities have impacted their forecasting and site selection efforts to advance a sponsor’s study and reduce overall costs.
The science behind proactive resource planning
“I like to think of the forecasting and site selection process as both an art and a science,” said Jones. “On the science side, we first need to commit to a recruitment timeline. We then determine the number of sites needed to meet that target and begin our research.”
To power their forecasts, Jones and her team make use of a proprietary, powerful informatics solution: Xcellerate® Forecasting & Site Selection. “We’re able to query data from our central laboratory that handles more than 40% of the world’s clinical trials,” said Jones. “This wealth of data helps us rank investigational sites according to past performance within the sponsor’s targeted therapeutic area. As a result, sponsors receive robust forecasts for projected patient recruitment and primary endpoints—information that forms the backbone of the study timeline.”
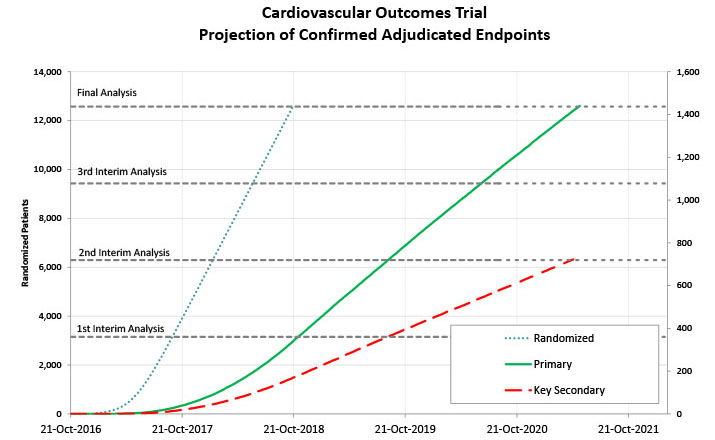
Projection of recruitment and endpoints help sponsors set expectations, plan better and implement necessary mitigating plans in a timely manner.
Generating these forecasts also requires accounting for multiple performance factors such as patient numbers, past data quality, screen failure rates, recruitment behavior over time within a study, and differences between countries.
Once enrollment begins, incoming data from the selected sites continue to feed into the forecasts to better estimate when the primary endpoint will be reached and identify any potential risks, such as low-performing sites, to reallocate resources or include additional countries and keep the study’s timeline on track.
The art of identifying high-performing sites
After the initial projections are generated and multiple scenarios are evaluated, the “artful” side of the process involves site optimization to ensure they are fully qualified to take on the study.
“Developing a list of sites is an iterative process,” said Ricketts. “We actually start very early—before we even know if we’ve won a study—to develop our site list and make sure a site is qualified to stand up to regulatory scrutiny. Sponsors might also have their own lists so we need to evaluate what type of doctor, institution and patient population is best suited for the trial based on our feasibility research.”
“One of the most advantageous ways to identify appropriate sites starts with the study’s protocol,” said Ricketts. “As our team builds the site list, we can view our central laboratory data through our Xcellerate® Informatics Suite to compare among our 11,000 protocols to find those relevant to the sponsor’s proposed project. We can then can drill down and focus on the investigators that have the right experience for their type of trial—a capability that no other company offers right now.”
Leveraging de-identified patient test results to improve enrollment results
Rickett’s team is also taking advantage of access to LabCorp test results—11 billion in total—to quickly identify the physicians who run the necessary tests on the patients that would be appropriate for a sponsor’s trial. Filtering by age, gender, disease state (through a clinical diagnosis code and/or test result), a geographic heat map can identify relevant patient population densities and match those to the highest performing investigators in the area from sites that have produced consistent, high-quality results. It can also be used to find untapped patient pools or to quantify the effect of changing the inclusion/exclusion criteria for a clinical study.
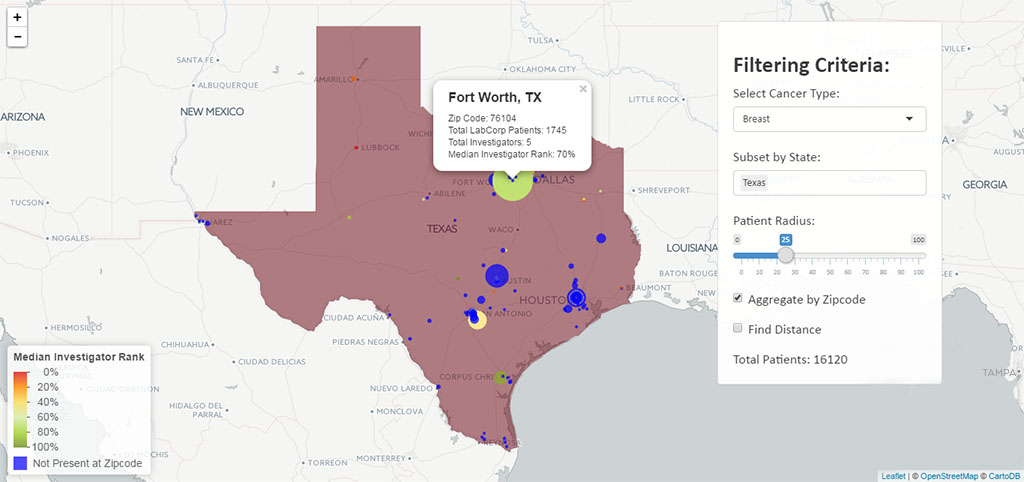
On this heat map, blue indicates where LabCorp has patients but no known investigators in the database, highlighting an area to recruit new investigators. The red-to-green range indicates performance of investigators at the ZIP Code with red representing an opportunity to improve, and green as sites with above-average recruitment, start up times and higher quality samples.
Reducing estimated timelines and costs
“With direct insight to a site’s history, performance and potential patient populations, we can build a very refined dataset to enable smarter decisions for our sponsors, helping them optimize patient enrollment and data quality in this crucial planning stage,” said Jones.
“Getting started faster and selecting the right locations is all about having evidence-based information,” said Jones. “With our forecasting and site selection process, we’ve been able to reduce our sponsor’s estimated timeline by up to seven months, which can reduce costs by millions of dollars. That’s why I’m excited to witness the rapid advances from new informatics capabilities and hope they continue to improve our sponsors’ clinical success.”
Read more: Xcellerate Forecasting & Site Selection